Volume of Recreational boating vessels in the U.S. 2010, 2019, 2021, by state
Table of Contents
How many boats are there in each state?
We gathered data from multiple sources including our own Boat-Alert history databases to give you a big picture of the count of boats registered in the USA by state. We hope you find this useful as it is provided in table format and charts for convenience. You should note that numbers have gone up significantly in the summer of 2021 due to many new boat buyers entering the market that year.
2021 Recreational Boating Statistics
The data sources below can conflict and it depends on the year the data was collected. Having said that, the numbers are still close within a few thousand boats. In some cases, the inactive boats (historical) may be counted. If you are looking for specifics on each state and how to title your boat, check Boat Registration and Titling in Each U.S. State.
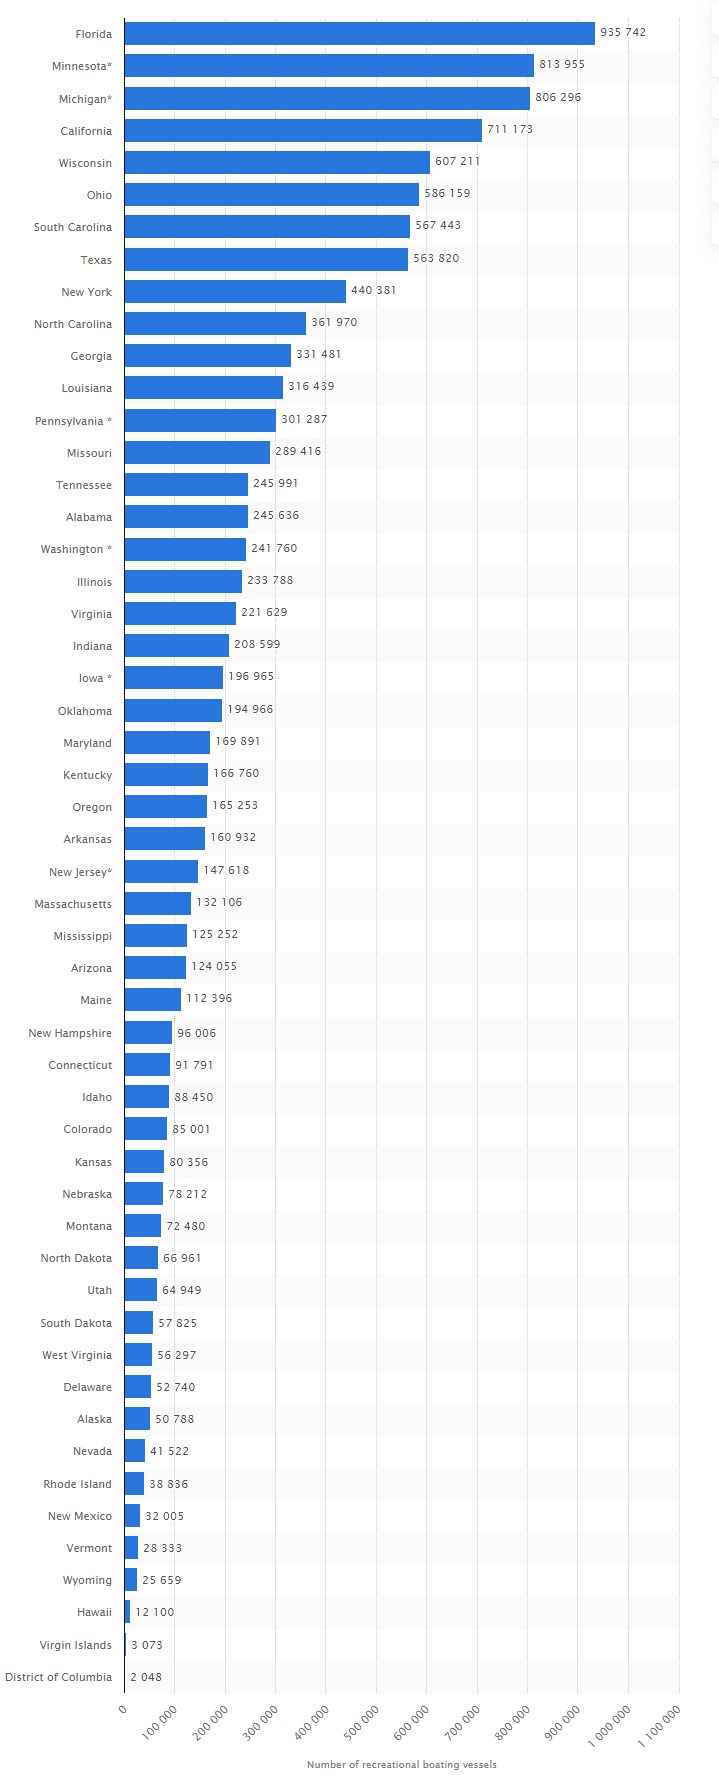
Top 20 states with most registered boats rankings
The top state with the most boats is probably Florida or California, However some charts show Minnesota as having more boats. This depends on how you count historical boats and when the data was collected. The table below lists the numbers to the best of our abilities but they can and will change by the end of the 2021 boating season. No matter how you slice it, the top ten boating states in the U.S. include Florida, California, New York and Michigan when ranking by revenue, registered boats or marinas by state.
Recreational Boat Registration Statistics Report
| US State | Number of Boats Per state | Percent of all boats in the USA in this state |
|---|---|---|
| Minnesota | 1,490,000 | 9.16% |
| Washington State | 1,212,000 | 7.45% |
| Florida | 1,200,000 | 7.38% |
| Michigan | 1,000,000 | 6.15% |
| California | 900,000 | 5.53% |
| Missouri | 795,000 | 4.89% |
| South Carolina | 780,000 | 4.79% |
| North Carolina | 635,723 | 3.91% |
| Tennessee | 600,000 | 3.69% |
| New York | 570,000 | 3.50% |
| Wisconsin | 570,000 | 3.50% |
| Texas | 550,000 | 3.38% |
| Ohio | 500,000 | 3.07% |
| Maine | 480,000 | 2.95% |
| Louisiana | 330,000 | 2.03% |
| Georgia | 326,000 | 2.00% |
| Virginia | 300,000 | 1.84% |
| Pennsylvania | 300,000 | 1.84% |
| Illinois | 270,000 | 1.66% |
| Alabama | 250,000 | 1.54% |
| Indiana | 220,000 | 1.35% |
| Oregon | 216,000 | 1.33% |
| Iowa | 211,000 | 1.30% |
| Oklahoma | 200,000 | 1.23% |
| Kentucky | 180,000 | 1.11% |
| Maryland | 170,000 | 1.04% |
| Arkansas | 170,000 | 1.04% |
| Utah | 160,000 | 0.98% |
| Arizona | 150,000 | 0.92% |
| New Jersey | 150,000 | 0.92% |
| Massachusetts | 130,000 | 0.80% |
| Mississippi | 120,000 | 0.74% |
| New Hampshire | 100,000 | 0.61% |
| Idaho | 89,000 | 0.55% |
| Connecticut | 85,000 | 0.52% |
| Kansas | 80,000 | 0.49% |
| Nebraska | 74,000 | 0.45% |
| Montana | 72,000 | 0.44% |
| Hawaii | 70,000 | 0.43% |
| Alaska | 68,000 | 0.42% |
| West Virginia | 60,000 | 0.37% |
| Colorado | 56,000 | 0.34% |
| North Dakota | 56,000 | 0.34% |
| Delaware | 55,000 | 0.34% |
| South Dakota | 53,000 | 0.33% |
| Rhode Island | 40,000 | 0.25% |
| Wyoming | 39,000 | 0.24% |
| Vermont | 38,000 | 0.23% |
| Nevada | 37,000 | 0.23% |
| New Mexico | 32,000 | 0.20% |
| Puerto Rico | 25,000 | 0.15% |
| U.S. Virgin Islands | 3,000 | 0.02% |
| Washington DC | 2,000 | 0.01% |
| Guam | 900 | 0.01% |
| american samoa | 75 | 0.00% |
| TOTAL | 16,270,698 |
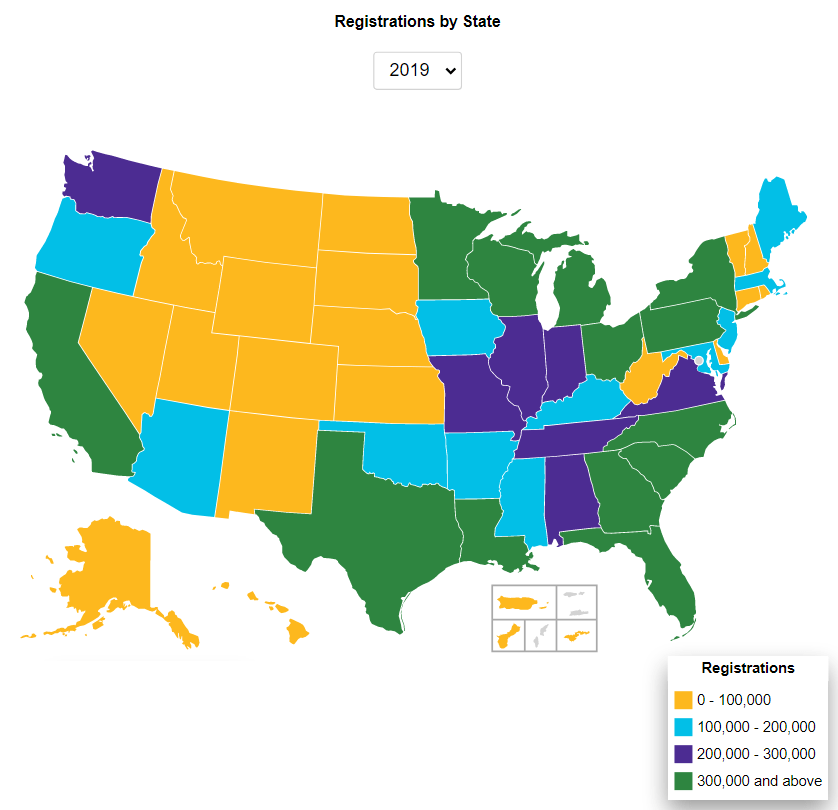
Animation comparison:
Top sales figures for boats in each state
There were 13.0 million recreational boats registered in the United States in 2002 according to the U.S. Coast Guard. Today, in 2021, it is closer to 16.0 million.
Recreational Boat Registration Statistics Report for 2020
Historical Data
Back in 2002, the top 20 states and the total number of boats registered in each used to be:
- California 1,051,606
- Michigan 1,000,337
- Florida 922,597
- Minnesota 834,974
- Wisconsin 650,280 (greatest increase from 2001 to 2002)
- Texas 624,390
- New York 529,732
- Ohio 413,276
- Illinois 398,431
- South Carolina 383,971
- Pennsylvania 357,729
- North Carolina 353,625
- Louisiana 327,272
- Missouri 325,717
- Georgia 325,135
- Washington 266,717
- Alabama 264,191
- Tennessee 259,235
- Virginia 243,590
- Mississippi 199,037
According to 2009 NMMA annual sales data, the top 10 boating states in the U.S. were:
- Florida
With a year round warm climate and thousands of miles of shoreline, it is not surprising that Florida continues to be ranked number one in the top ten boating states in the U.S. 2009 Boat Sales: $1.2 billion. - Texas
Ranking 6th in the U.S. for registered recreational boats; boaters in the state of Texas enjoy more square miles of inland waterways than any other state in the U.S. 2009 Boat Sales: $906 million. - California
Bordered by the Pacific Ocean, boaters in the state of California have access to the ocean, bays, lakes and rivers as well as a warm and mild year round climate. 2009 Boat Sales: $417 million. - North Carolina
From coastal boating to inland rivers and lakes, boating is one of the state’s most popular sports with over 300,000 registered boaters in North Carolina. 2009 Boat Sales: $395 million. - New York
With more than 7,500 lakes, ponds and reservoirs and over 50,000 miles of rivers and streams, boating is a favorite pastime in the state of New York. 2009 Boat Sales: $381 million. - Louisiana
Surrounding by the Gulf of Mexico, boating is a way of life in the state of Louisiana from fishing charters to pleasure cruisers. 2009 Boat Sales: $370 million. - Washington
Despite the shorter boating season, boaters love Washington’s hundreds of miles of protected saltwater and surrounding waterfront communities. 2009 Boat Sales: $310 million. - Delaware
An unexpected entry on the top 10 list, Delaware is the second smallest state in the U.S. Although Delaware is bordered by the ocean and bay, many boats are likely purchased for use in Maryland waterways on the Chesapeake Bay. 2009 Boat Sales: $330 million. - Michigan
The Great Lakes, inland lakes and rivers in Michigan gives much of the state easy access to fresh water boating despite a colder climate. 2009 Boat Sales: $317 million. - Minnesota
With 11,842 lakes, 69,200 miles of rivers and streams and about 4,000 miles of water trails, boating is a focal point for outdoor activity for Minnesota. 2009 Boat Sales: $308 million…
For details on the 2014 boating statistics visit U.S. Boat Registrations Report (nmma.org).
Video of historical data changes for state boat counts:
Number of Marinas by state:
Top ten boating states ranked by number of marinas by state:
- New York
- Florida
- Michigan
- Maryland
- California
- New Jersey
- Washington
- Massachusetts
- Wisconsin
- Ohio
Read Related Articles:
- Sea Doo VIN Lookup (Jet Ski & PWC HIN Lookup)
- How to Navigate the Legal Process of buying a used Boat
- Your Boat Insurance Claim can be Denied due to unrelated contract violations
- Hull Identification Number lookup – HIN Search
- Wisconsin Boat Registration
Categories: To learn more about Boat-Alert.com History Reports for used boats and find a boat registration search service visit: www.Boat-Alert.com